Features
Spending reports
Where the month went, at a glance
A dashboard for any period, a spending trend you can drill into, and breakdowns by card, merchant, division and group.
What you can do
Dashboard with change from the last period and top merchants
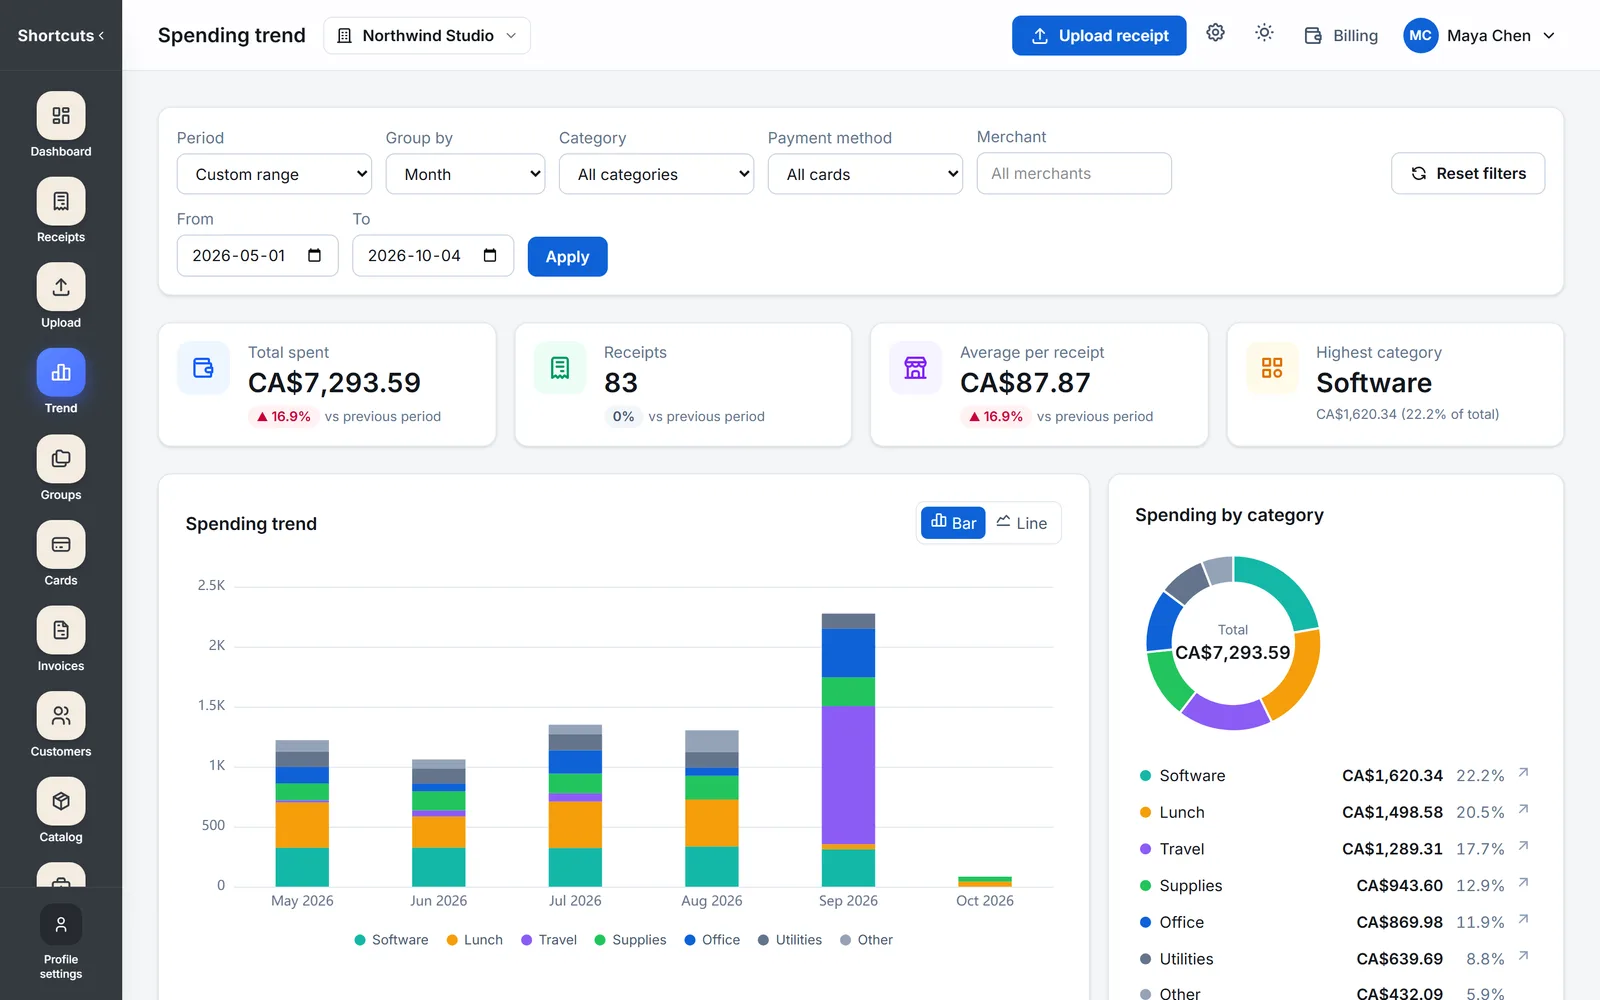
Trend by day, week, month or quarter, stacked by group
Click a bar to open the receipts behind it
Breakdowns by card, merchant, division and group
More
Explore more
Receipt scanner
From paper to saved in five taps
AI receipt reading
Stop typing receipts by hand
Payment cards
Every receipt, by the card that paid
Companies, divisions & groups
Every business on its own books
Card rules
Set it once, filed forever
Smart filing
The AI files — it never invents
Search & filters
Find any receipt in seconds
Invoicing
Invoice customers, taxes worked out for you
Accountant workspaces
Your clients upload, the AI files, you review
Multiple companies
Every business on its own books, one sign-in
Dashboard & spending trend
Spot the change before it’s a habit
Bulk upload
A shoebox of receipts in one go
Invoice PDFs & sharing
Send it, share it, get paid
Team plans
One plan for the whole team
Security & privacy
Built so your data stays yours
Ready to stop losing receipts?
SpendFlow for iPhone and Android.